

Five Forces Reshaping Trade Activity and Used Vehicle Acquisition
The used vehicle market has stabilized from the volatility of the pandemic years, but dealers are operating in a very different environment than they were even three years ago. Affordability pressures remain elevated, consumers are holding vehicles longer, EV values continue to fluctuate, and acquisition decisions have become increasingly dependent on vehicle-specific demand rather than broad market trends. The result: trade strategy matters more than ever.
1. Consumers are holding vehicles longer
Americans are keeping their vehicles longer than at any point in modern history. According to S&P Global Mobility, the average age of vehicles on U.S. roads reached 12.8 years in 2025 — the highest level ever recorded.¹ Older vehicles generate more service revenue, replacement cycles are becoming less predictable, and when consumers do enter the market, their trade often represents a larger portion of the purchase decision.
DEALER TAKEAWAY
Trade conversations are happening later in the ownership cycle, making it increasingly important to identify high-intent shoppers before they submit a traditional lead.
2. Affordability remains the industry’s biggest challenge
Vehicle prices have moderated from pandemic-era peaks, but affordability remains one of the biggest barriers to purchase. According to Experian’s Q1 2026 State of the Automotive Finance Market, used vehicles now account for more than 61% of financed vehicle purchases, financing terms remain extended, and growth is occurring outside traditional prime credit tiers.² For many shoppers, the monthly payment — not the vehicle price — is still the primary buying consideration.
DEALER TAKEAWAY
A shopper’s trade value is often the largest lever available to reduce payment burden. Dealers who understand trade position early gain an advantage in structuring deals that work.
3. The used vehicle market has stabilized — but not evenly
Manheim’s Used Vehicle Value Index shows wholesale values stabilizing after several years of volatility, but pricing performance varies considerably across vehicle segments, brands, and geographies.³ Broad averages can mask meaningful differences between brand, body style, fuel type, vehicle age, and region. This fragmentation is one of the clearest themes uncovered throughout this report.
DEALER TAKEAWAY
National used vehicle trends provide context. Acquisition decisions increasingly require local and vehicle-specific discipline.
4. EVs continue to create valuation volatility
New-vehicle price reductions, increased lease returns, evolving battery technology, consumer concerns around charging infrastructure, and expanding model availability continue to pressure used EV values. Experian data shows EV share of new vehicle purchases declined from 9.84% in 2025 to 6.06% in Q1 2026, while hybrid share increased.² Several EV-focused brands show some of the weakest valuation performance in this report’s trade data.
DEALER TAKEAWAY
EV trades increasingly require their own appraisal discipline. Historical depreciation assumptions used for internal combustion vehicles may no longer apply.
5. Trade activity has become one of the clearest buyer signals
Traditional lead metrics tell dealers who raised their hand. Trade activity often reveals who is preparing to buy. When shoppers value a trade, request an offer, explore payments, monitor vehicle equity, or re-engage with ownership tools, they reveal information about both their vehicle and their purchase readiness.
DEALER TAKEAWAY
The most valuable trade isn’t always the vehicle. It’s the shopper behind it.
ABOUT THE DATA
Protomiq’s market insights are built from proprietary vehicle market data collected daily from more than 17,000 dealership websites, analyzed across OEM, body style, region, and make-level segments to identify where values are strengthening, where discount pressure is building, and where acquisition risk is changing.
1. S&P Global Mobility, Average Age of Light Vehicles in the U.S. Hits Record High in 2025, May 2025.
2. Experian Automotive, State of the Automotive Finance Market, Q1 2026.
3. Cox Automotive / Manheim, Used Vehicle Value Index and Wholesale Market Insights, 2026.
Broad averages are no longer enough
This report helps dealership leaders understand why broad used-car market averages are no longer sufficient for pricing, appraisal, acquisition, and inventory strategy.
The data shows a fragmented used-vehicle market. Some OEMs, body styles, and regions are showing renewed strength in 2026, while others remain under pressure. Dealers that rely on national averages or outdated 2021–2022 assumptions may expose themselves to appraisal risk, margin compression, and slower inventory turn.
- 2022 was the peak: The strongest period across most cuts of the data — a comparison year, not a benchmark.
- 2025 was the soft patch: The softest recent period in several views, with the West and Northeast turning negative.
- 2026 recovery is uneven: Recovery in some areas, but not evenly — OEM-level performance is highly split.
- EV brands under pressure: EV-heavy brands show consistent negative valuation movement across recent periods.
- Selective strength: Coupes, convertibles, and select luxury brands outperform the broader market.
- Caution categories: Full-size vehicles, sedans, wagons, and several mainstream OEMs require more discipline.
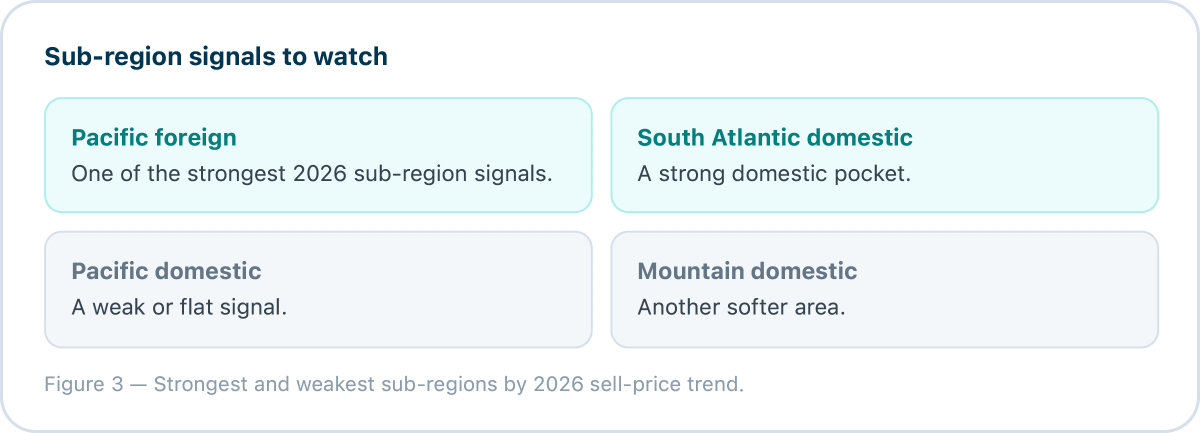
Regional strategy matters as well — especially the contrast between West/Pacific domestic and Pacific foreign, and the strength of South Atlantic domestic. The analysis draws on all-OEM, foreign/domestic, regional, body-style, and OEM-level valuation data collected from January 2021 through April 2026.
Why used vehicle strategy needs to get more granular
Many dealers still talk about “the used car market” as if it moves in one direction. The data shows that is no longer accurate. This fragmentation lands directly on dealership operations:
- Appraisal teams are under pressure to win trades without overpaying.
- Used car managers are managing thinner margin windows.
- Pricing teams need faster repricing discipline.
Sales teams are facing more payment-sensitive shoppers. - Inventory managers need better guidance on which vehicles deserve aggressive acquisition.
The key message of this report: the market is not simply strong or weak. It is selectively strong and selectively risky. The sections that follow break the market down by year, region, body style, and OEM to show exactly where that selectivity lives — and what to do about it.
Methodology and data overview
The analysis covers January 2021 through April 2026 and uses multiple cuts of Protomiq vehicle market data: total market / all-OEM view, foreign OEM breakdown, domestic OEM breakdown, regional breakdown, body-style breakdown, and an OEM-level readout.
Transparency note: field definitions were inferred from source column names, so the analysis should be read as directional.
- A positive sell-price trend does not always mean strong gross.
- Negative MSRP discount pressure can exist even when sell prices are rising.
- Low sample-size OEMs should be treated cautiously.
- Make-level insights should still be validated by model, mileage, trim, condition, and local market demand.
2022 was the peak, 2025 was the soft patch, 2026 is fragmented
Across several cuts of the data, 2022 showed unusually strong positive movement. By 2025, several metrics had softened sharply. In 2026, some categories recovered while others remained weak. Regionally, 2022 was strong across every major region; 2025 was weak, with the West and Northeast turning negative; and 2026 returned to positive sell-price movement across major regions — while MSRP discount pressure remained negative.
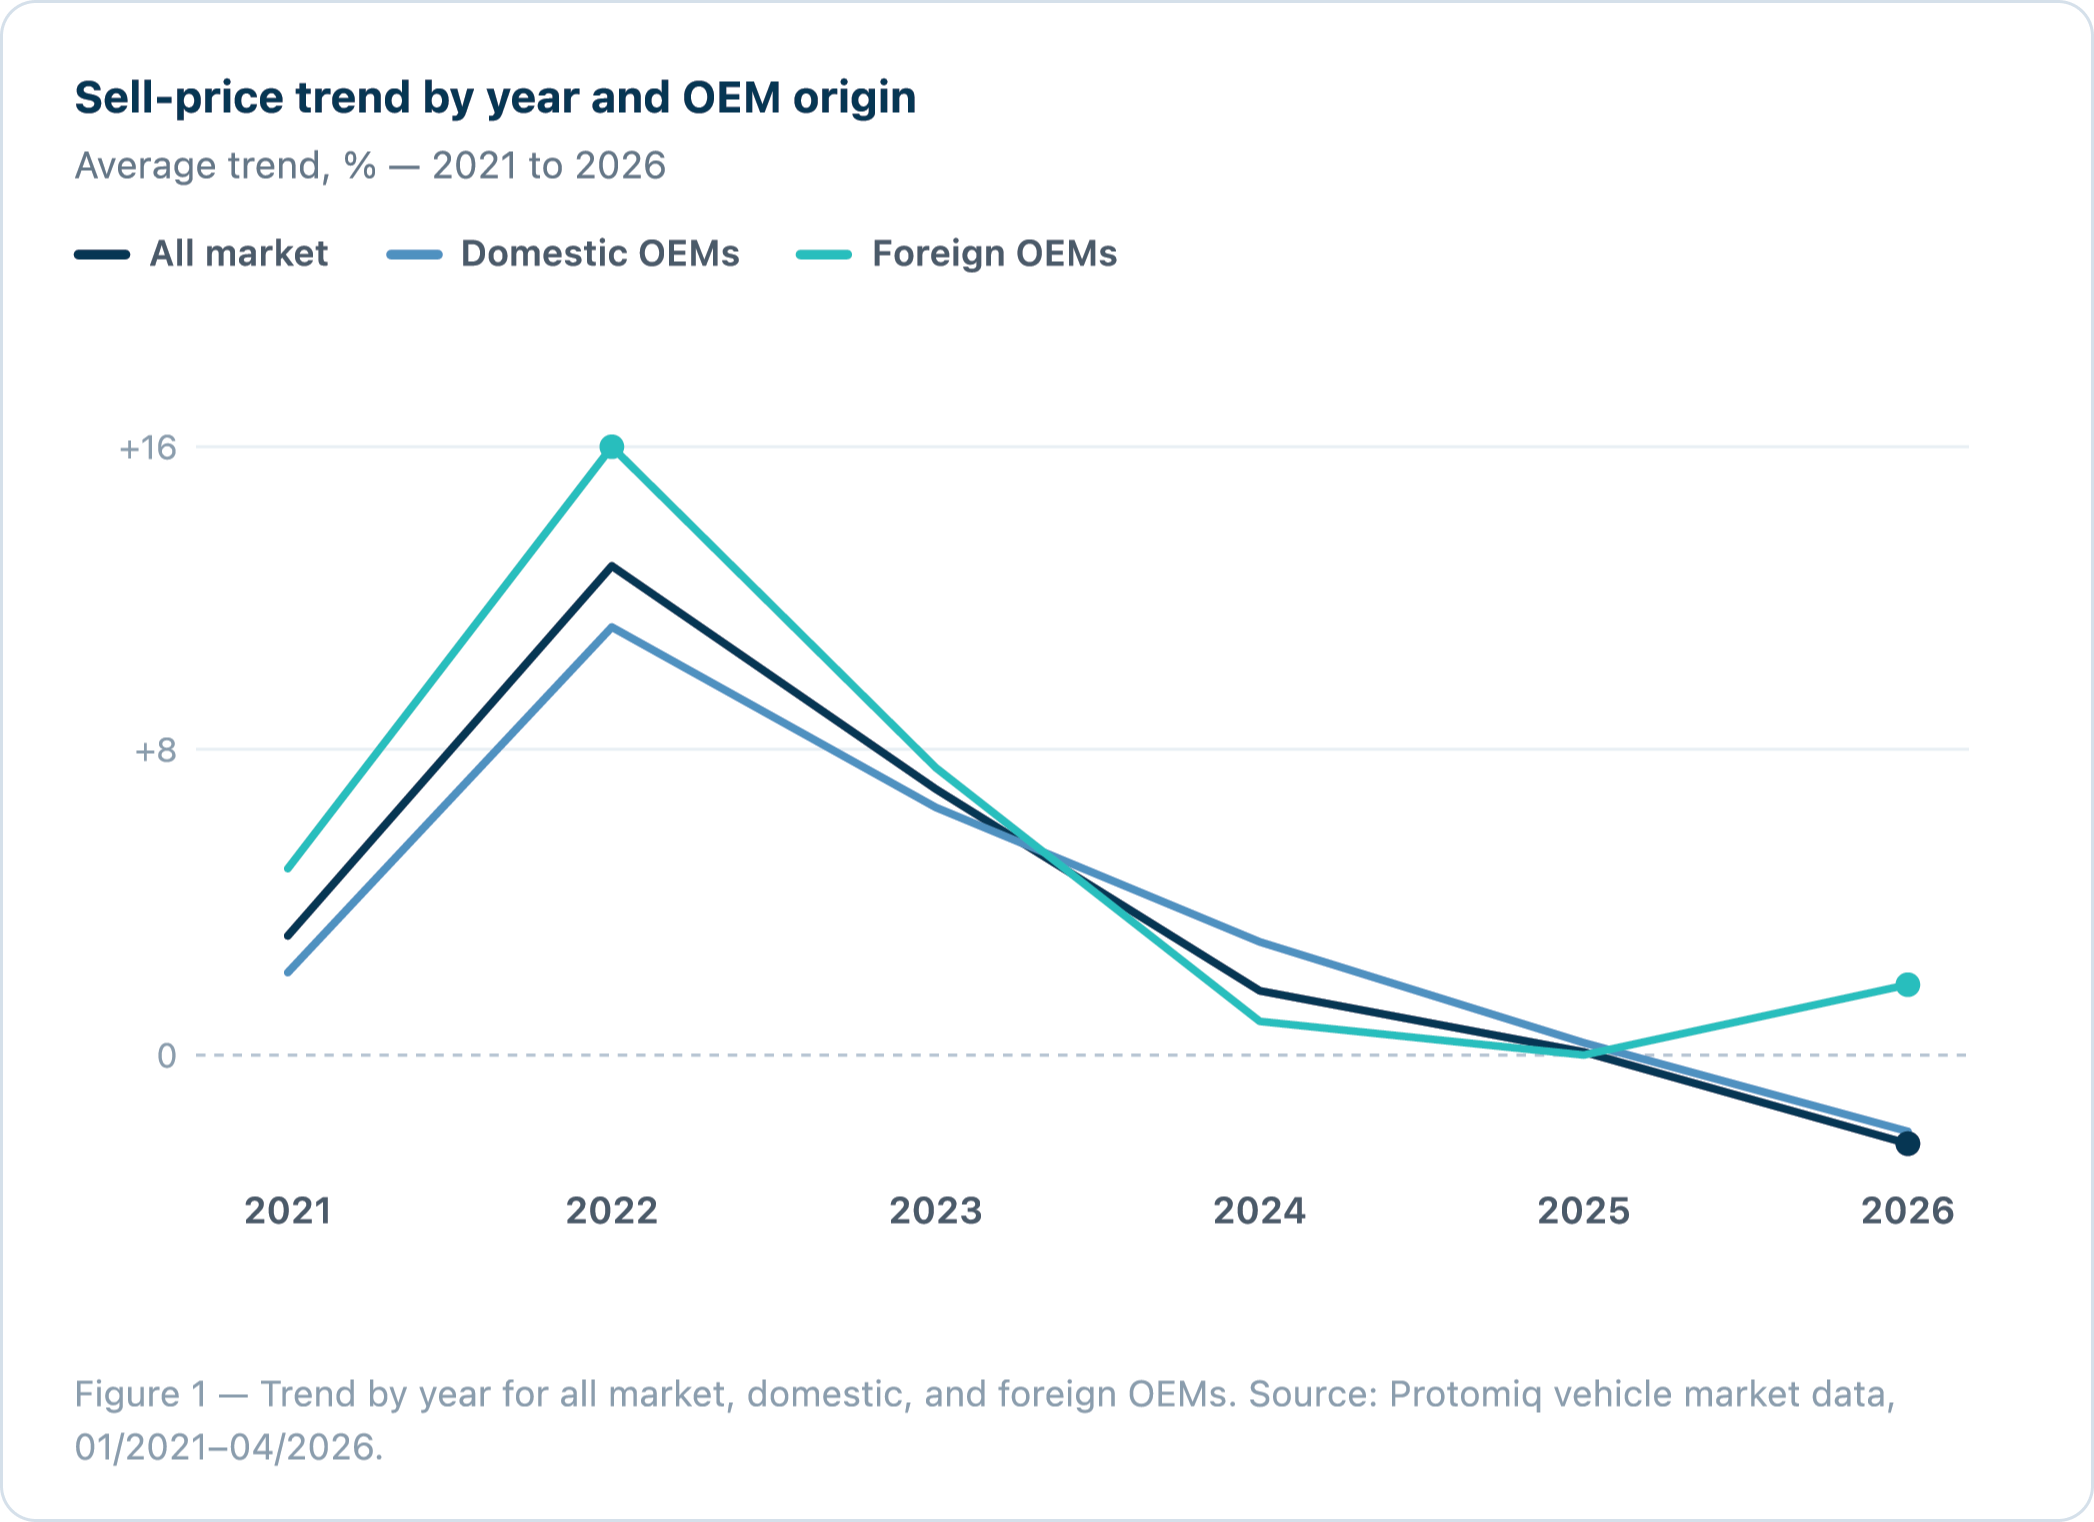
“2022 was not normal. Treat it as a peak comparison year, not a current operating benchmark.”
DEALER TAKEAWAY
Do not use 2021–2022 market behavior as the baseline for current appraisal or pricing strategy.
Regional market fragmentation: where 2026 strength is showing up
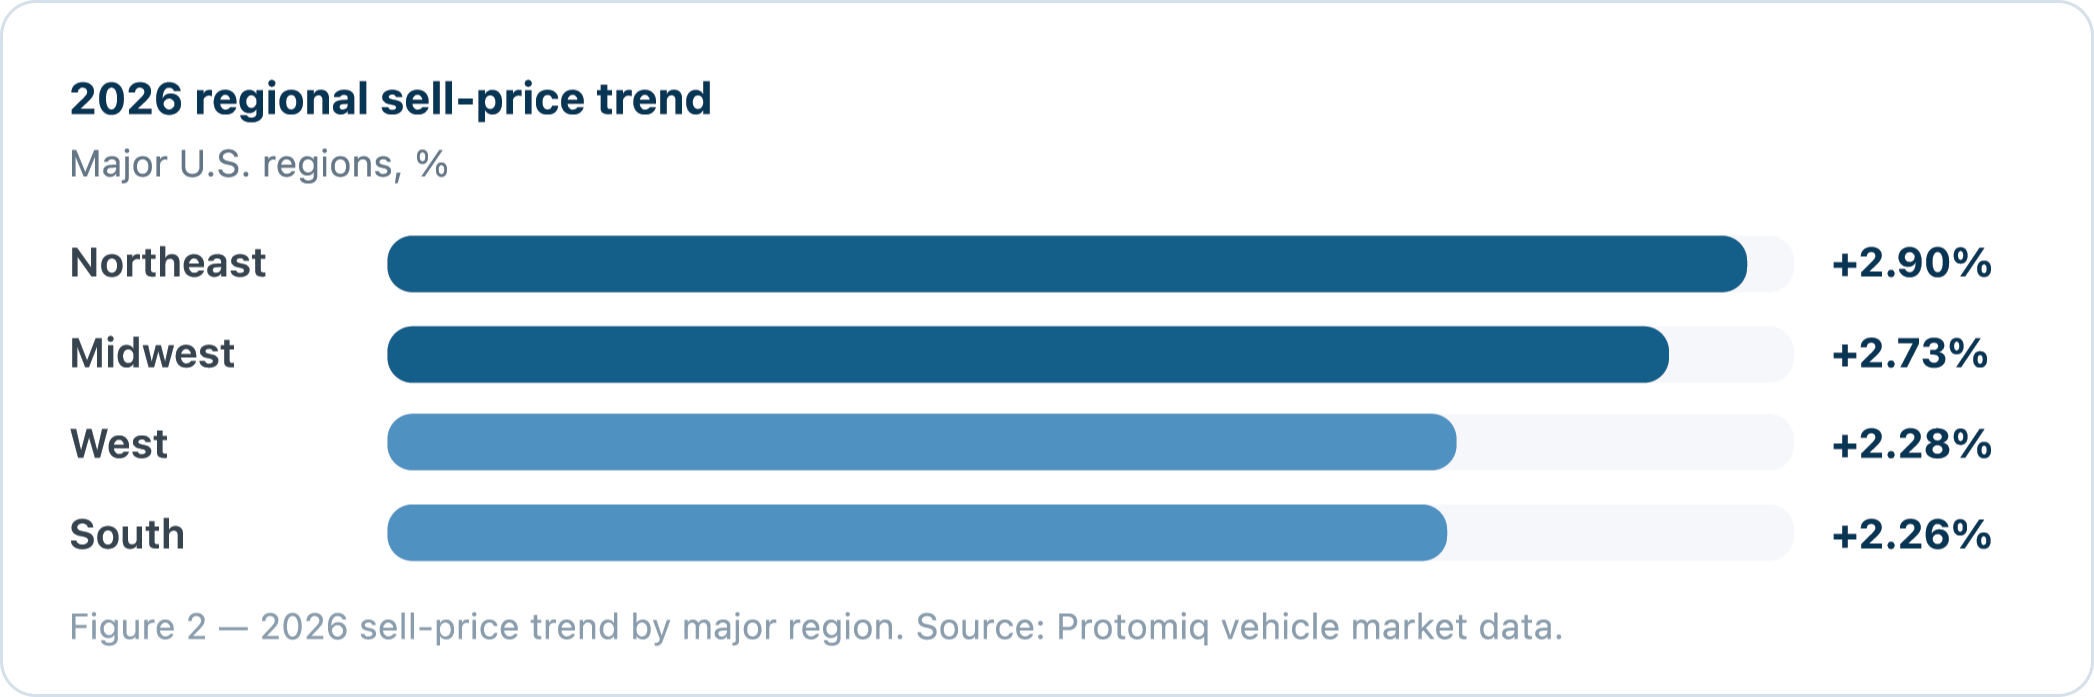
The 2026 regional data shows positive sell-price movement across major regions, but the degree of discount pressure varies. The Northeast leads at +2.90%, followed closely by the Midwest at +2.73%; the West (+2.28%) and South (+2.26%) trail — and the West carried the most negative 2026 MSRP discount pressure among the major regions at −2.64%.
In 2026, foreign OEMs were stronger in the West, domestic OEMs were stronger in the Midwest and South, and the Northeast was closer — with foreign slightly stronger.
DEALER TAKEAWAY
Regional strategy should influence appraisal aggressiveness. A vehicle that makes sense in one region may require a different acquisition posture in another.
Body style winners and risk pockets
Body style is one of the clearest separators between opportunity and risk. The strongest 2026 sell-price trends belong to coupes (+12.18%) and convertibles (+8.17%), with mini-vans (+2.20%), SUVs (+1.35%), and pickups (+0.58%) modestly positive. The weaker categories: full-size (−4.28%), wagon (−1.13%), sedan (−0.50%), and chassis (−0.37%).
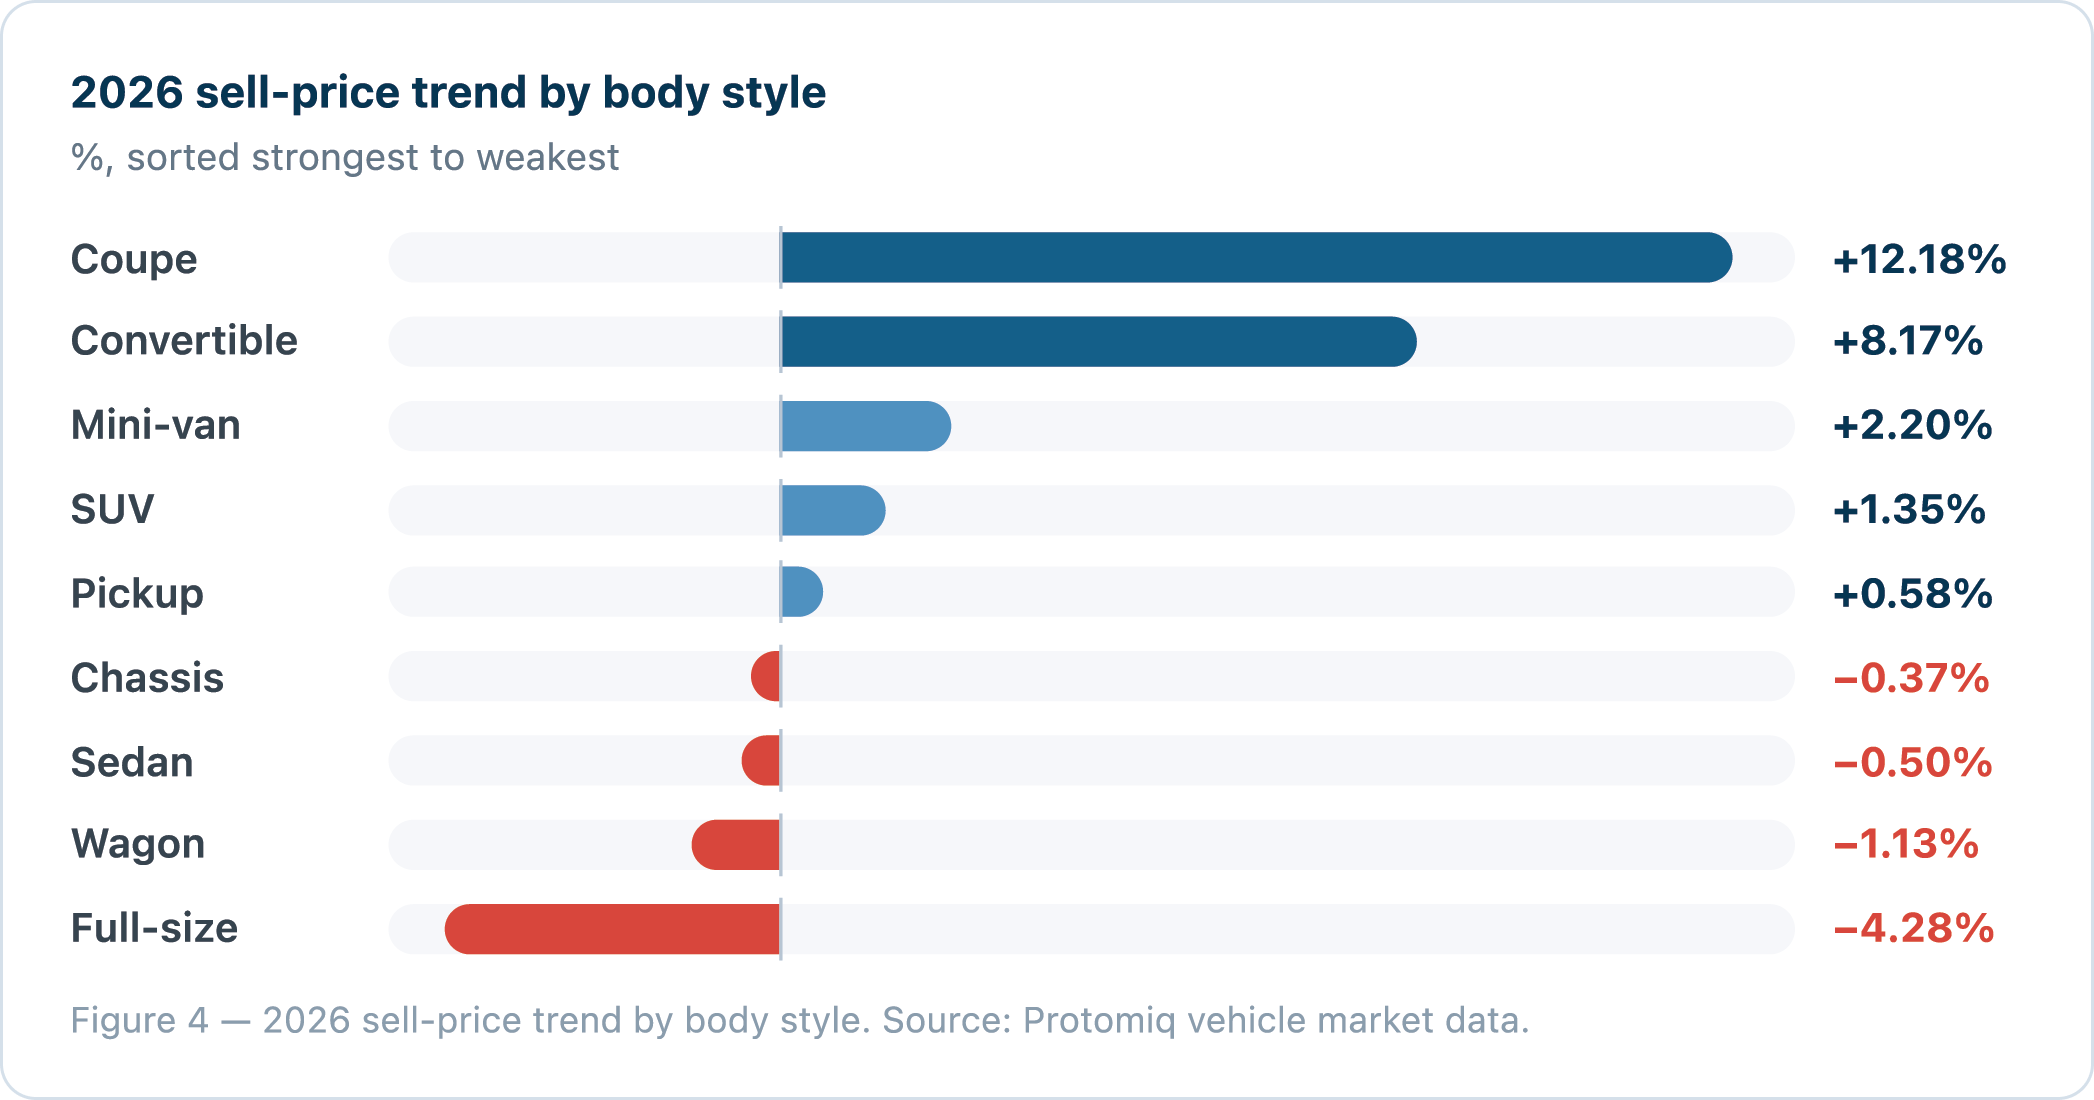
SUVs and pickups remain core dealership inventory, but their 2026 trends are only modestly positive. The data does not support blanket aggressive bidding on those categories. “Core inventory is not automatically low-risk.”
DEALER TAKEAWAY
Treat body style as a core appraisal input. Coupes and convertibles may offer selective opportunity, while full-size, sedan, wagon, and certain pickup segments may need tighter pricing discipline.
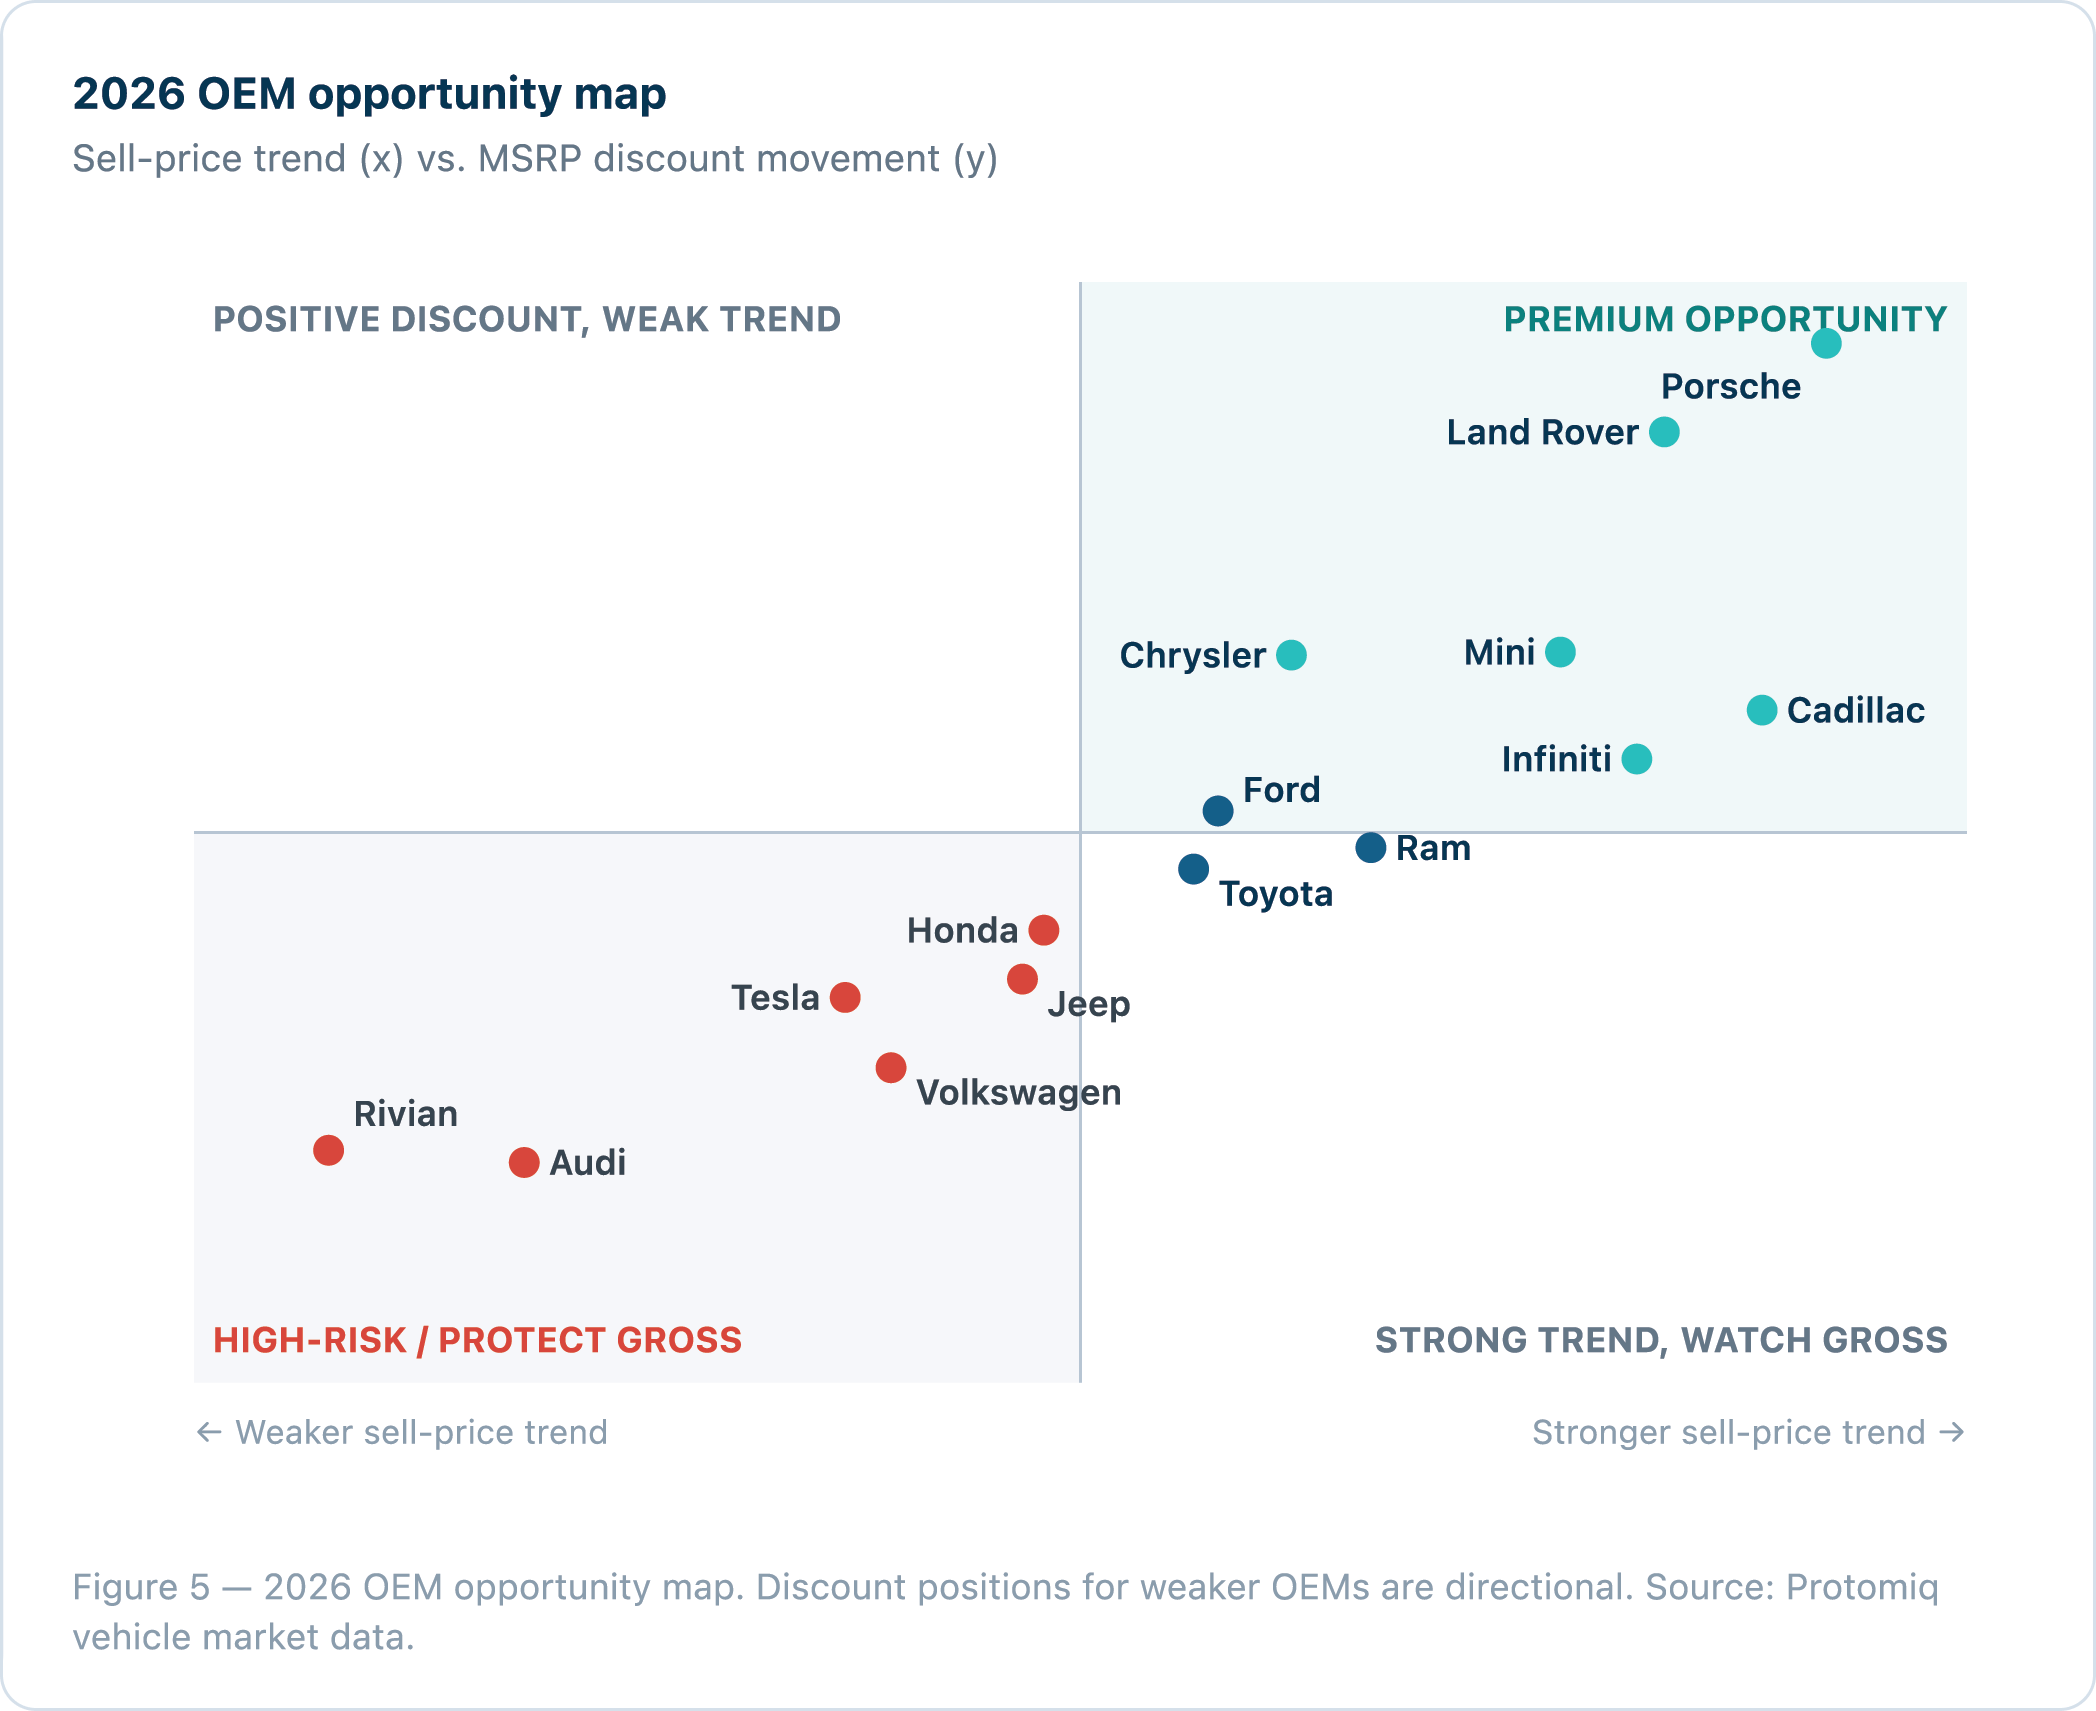
The market is being decided brand by brand
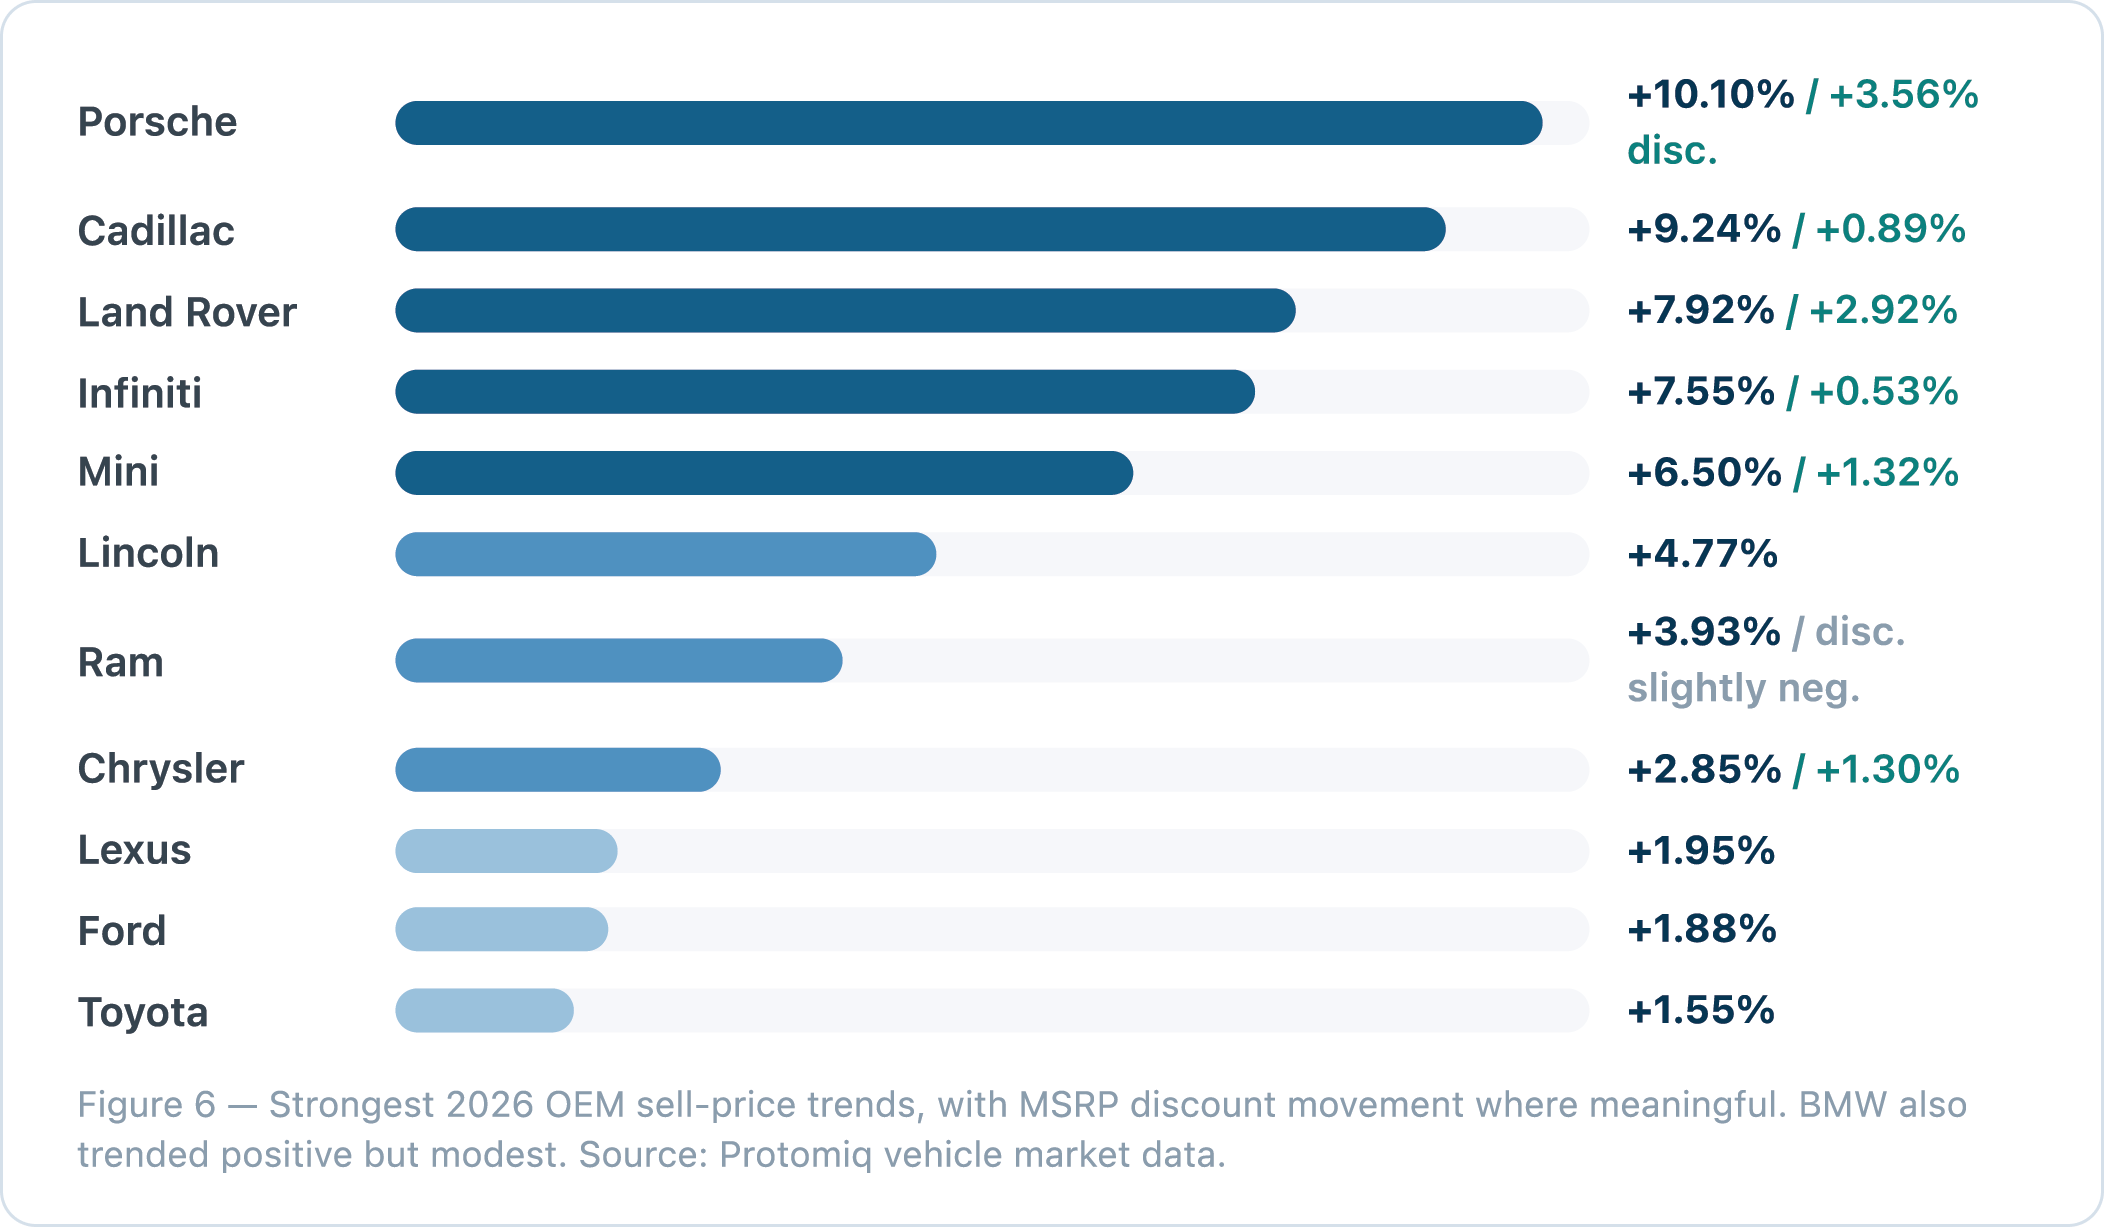
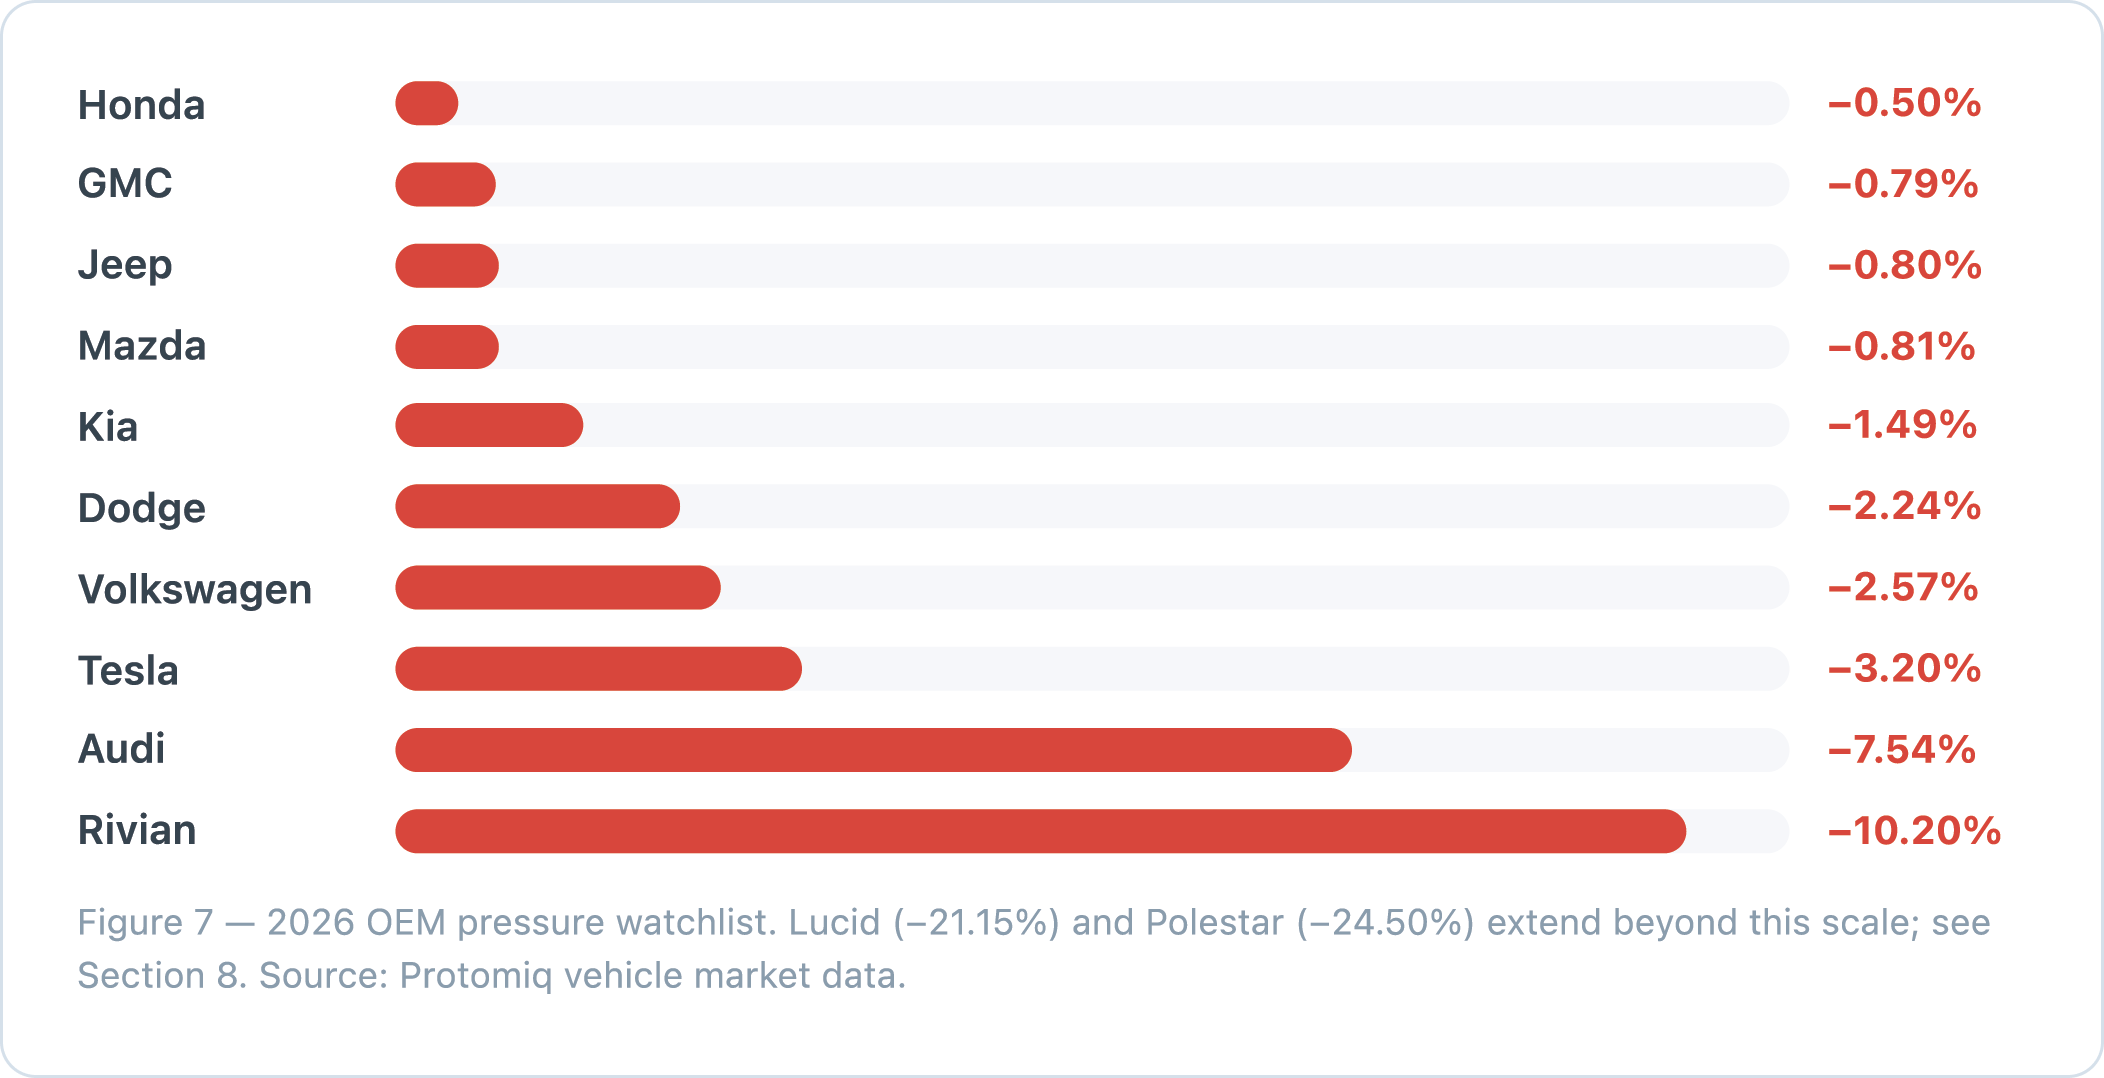
The OEM readout shows that 2026 strength is highly uneven. Some brands show both positive sell-price movement and positive discount movement, while others remain under meaningful pressure.
Stronger 2026 OEM signals
Weaker 2026 OEM signals
EV pressure: the clearest risk category
The OEM data shows consistent pressure among EV-heavy and newer EV brands. Every brand in this group posted a negative 2026 sell-price trend — several of them steeply negative.
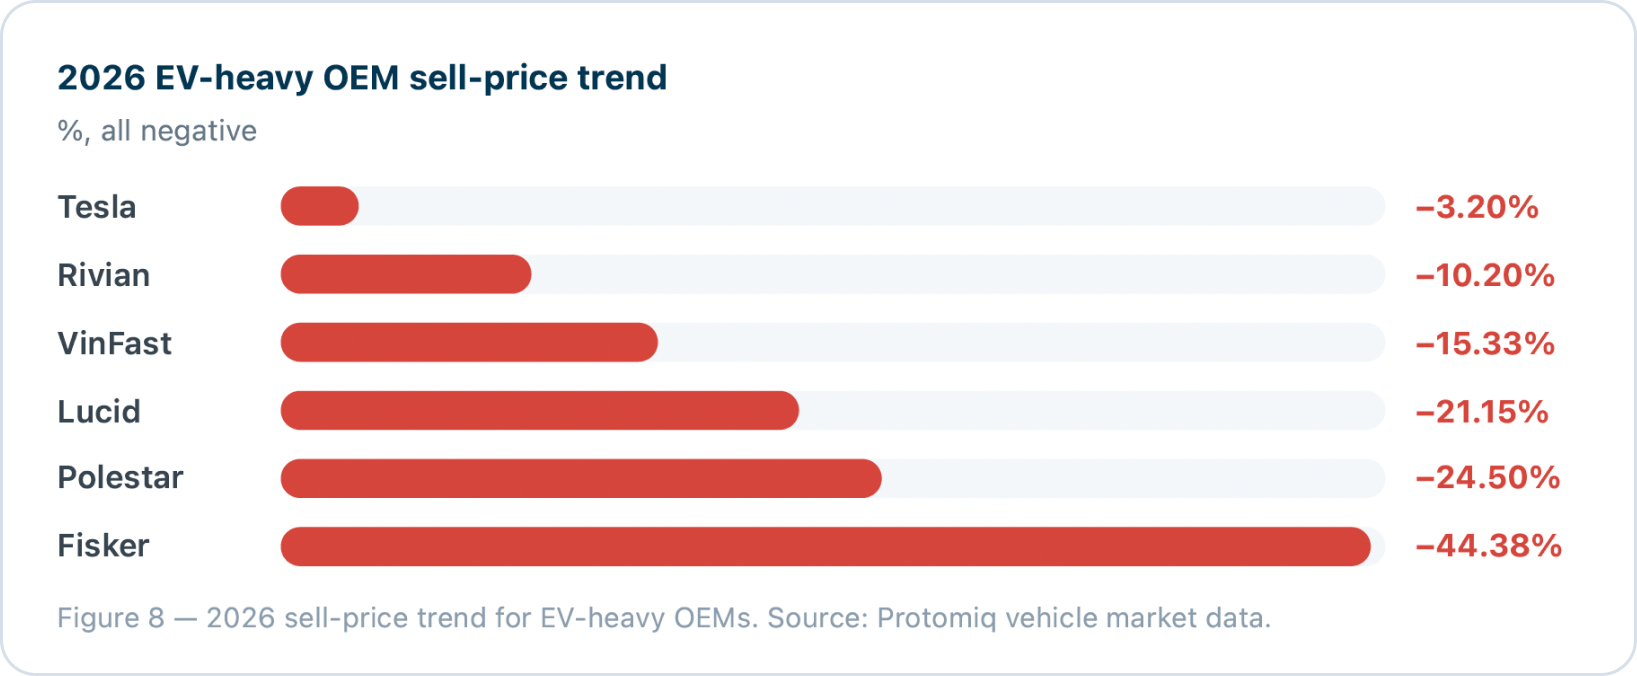
Several forces compound this pressure: EV incentive changes, new-EV price cuts, steep used-EV depreciation, consumer concerns around range and charging, battery condition and technology obsolescence, and a wave of lease returns adding used EV supply.
DEALER TAKEAWAY
EV trades should not be appraised using traditional ICE assumptions. Dealers need a separate EV appraisal workflow.
EV appraisal checklist for used car managers
- Battery health
- Range
- Charging standard
- Incentive exposure
- Current new-EV pricing
- Local days-to-sale
- Model-year technology changes
- Certified or warranty status
Macro conditions creating pressure on the used market
9.1 High borrowing costs and payment sensitivity
Elevated auto loan rates continue to pressure affordability, monthly payments, and used-vehicle demand. Dealer connection: payment-sensitive shoppers may resist price increases, even where sell-price trends are positive.
9.2 New-vehicle prices and incentives
New-vehicle affordability and OEM incentives directly affect late-model used values. Dealer connection: if new-car incentives increase for an OEM, late-model used inventory from that same OEM may need faster repricing.
9.3 Used-vehicle supply constraints
Lower prior-year production, lease maturity patterns, and wholesale supply can support used prices overall. Dealer connection: tight supply may help the market broadly, but it does not protect every make equally.
9.4 Credit and delinquency pressure
Credit quality, down payment availability, and negative equity all affect conversion. Dealer connection: sales teams need stronger payment-first desking and equity conversations.
9.5 Fuel prices and body-style mix
Fuel prices influence demand across trucks, SUVs, sedans, hybrids, and compact vehicles. Dealer connection: relevant to pickup, SUV, sedan, and hybrid acquisition strategy.
9.6 EV policy and demand uncertainty
Incentives, infrastructure, and price competition continue to affect EV residual values. Dealer connection: EVs require shorter appraisal shelf life and more frequent pricing reviews.
What this means for dealer operations
10.1 Appraisal strategy
Move from broad market appraisal rules to:
- OEM-specific guardrails
- Body-style adjustments
- Regional modifiers
- EV-specific risk checks
- Recent-period weighting over 2021–2022 assumptions
10.2 Acquisition strategy
More constructive: Cadillac, Porsche, Land Rover, Infiniti, Mini, Ram, Lincoln, Chrysler, Lexus, BMW, Ford, Toyota — plus select coupes and convertibles.
More cautious: Tesla, Rivian, Lucid, Polestar, Audi, Volkswagen, Jeep, Dodge, GMC, Honda, Mazda, Kia — plus full-size vehicles, sedans, wagons, and weak regional/body-style combinations.
10.3 Pricing strategy
- Reprice aging units faster in weak OEM/body-style categories.
- Watch new-car incentives by OEM.
- Track local days-to-sale.
- Avoid assuming a positive sell-price trend equals margin expansion.
10.4 Marketing strategy
Use the data to create demand-generation messaging around smart trade timing, equity reviews, payment fit, high-demand inventory, brand-specific value stories, and market-based appraisal transparency.
10.5 Sales process
Train sales teams to explain why trade values vary by make and body style, why EV values are moving differently, why payment and affordability matter, and why current market data matters more than what a customer saw online months ago.
The practical dealer playbook
Appraisal rules of thumb
- Use 2025–2026 trend data more heavily than 2021–2022.
- Require live comps for weak OEMs.
- Add an EV review step.
- Tighten appraisal windows on full-size, sedan, wagon, and weak OEM inventory.
Pricing cadence
Strong categories: normal cadence with margin protection. Mixed: weekly review. Weak: accelerated review. EVs: shortest review cycle.
Inventory scorecard
Create a simple internal scoring model weighing: OEM trend · body-style trend · regional trend · MSRP discount pressure · sample confidence · days-to-sale · local supply · mileage/condition · model-level demand.
Figure 9 — Dealer acquisition action matrix. Source: Protomiq vehicle market data.
Marketing activation
- “Your trade value depends on what you drive.”
- “Some vehicles are holding value better than others.”
- “Get a current market-based trade review.”
- “Used vehicle values are shifting by brand, body style, and region.”
Four scenarios from the data
Case 1 // The Ram reset
Ram moved from negative territory in 2025 to +3.93% in 2026. A store holding its 2025 appraisal posture on Ram trades would have walked away from winnable, profitable inventory.
Lesson: Revisit appraisal strategy when an OEM trend changes materially.
Case 2 // The Jeep caution flag
Jeep remains under pressure across recent periods (−0.80% in 2026) despite strong consumer awareness. Familiarity with a brand is not a proxy for its valuation trajectory.
Lesson: High consumer awareness does not always equal appraisal safety.
Case 3 // Pacific foreign vs. Pacific domestic
Pacific foreign showed strong regional support in 2026 while Pacific domestic was weak. Two stores in the same market can face opposite acquisition conditions depending on the inventory they chase.
Lesson: Regional plus OEM-origin analysis can materially change acquisition posture.
Case 4 // EV trade-in risk
Tesla and newer EV brands show negative movement across the board. An EV appraised on ICE depreciation curves is an appraisal loss waiting to happen.
Lesson: EV appraisal needs a separate workflow.
Data limitations and responsible interpretation
- The data supports directional market insights.
- It does not include model, trim, mileage, condition, fuel type, dealer-level performance, or days-to-sale.
- Low-sample OEMs should not drive broad conclusions.
- Macro context should be used as operating context, not proof of causation.
- Dealers should combine this analysis with local market data and live retail comps.
The advantage goes to dealers who manage the market at the micro level
The 2026 used vehicle market is not one market. It is a collection of OEM, body-style, regional, and macro-driven micro-markets.
Dealers who continue to appraise and price based on broad used-car averages risk overpaying for weak inventory and missing opportunity in stronger pockets. Dealers who build more granular appraisal, pricing, and acquisition strategies will be better positioned to protect gross, improve turn, and capture consumer demand.
DEALER TAKEAWAY
Unlike traditional market reports that analyze completed transactions, Protomiq analyzes shopper behavior before the sale — capturing trade activity and digital engagement signals that reveal changing buyer intent earlier in the purchase journey.